Note
Go to the end to download the full example code or to run this example in your browser via Binder.
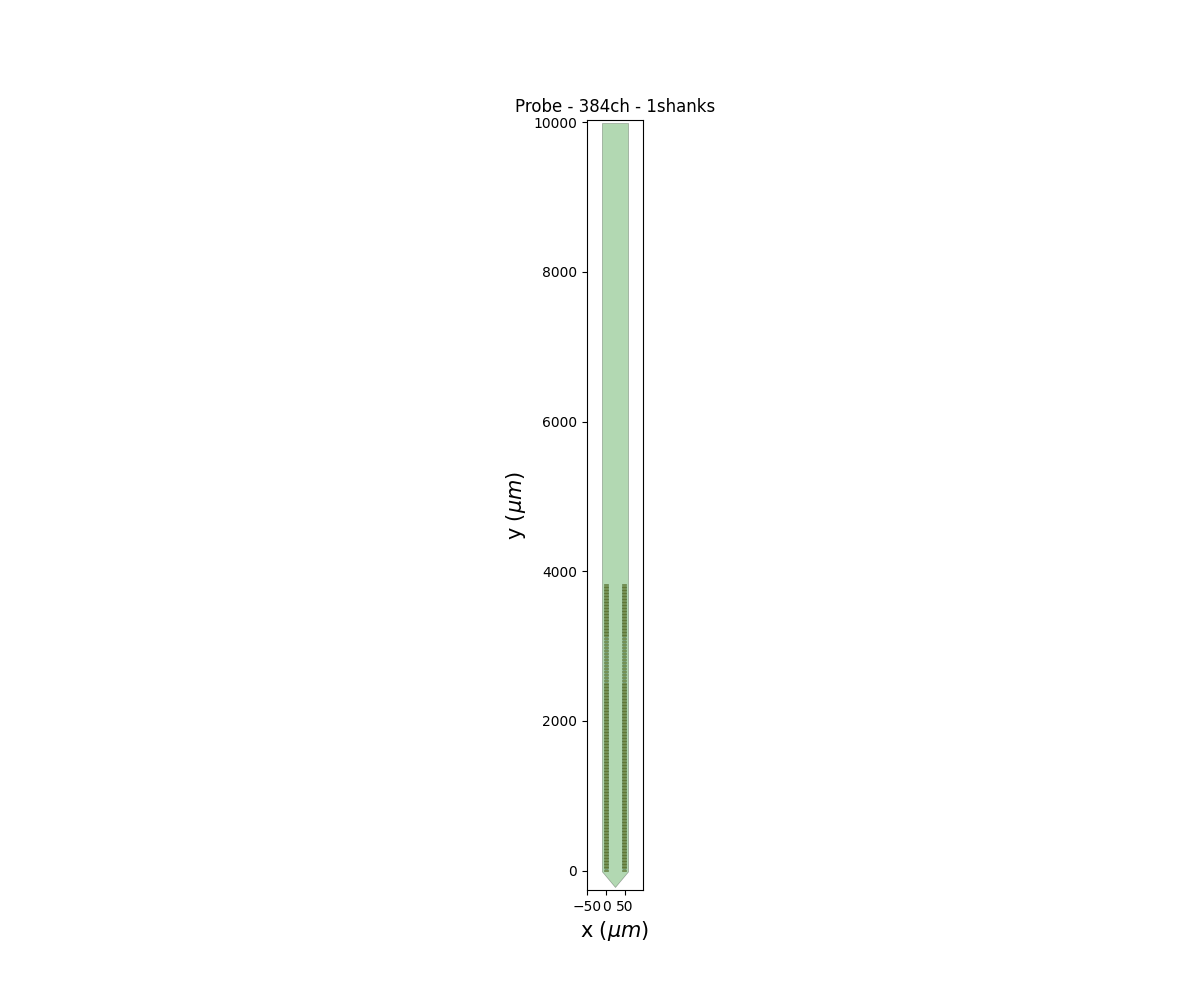
How to Plot the Probe#
This how-to demonstrates how to plot the probe. The probe
can also be saved to the session output folder. To get the
ProbeInterface object, use spikewrap.Session.get_probe()
/home/runner/work/spikewrap/spikewrap/spikewrap/process/_loading.py:146: UserWarning: The sessions or runs provided for are not in creation datetime order.
They will be concatenated in the order provided, as:
['recording2', 'recording1'].
  warnings.warn(

Loading data from path: /home/runner/work/spikewrap/spikewrap/spikewrap/examples/example_tiny_data/openephys/rawdata/sub-001/ses-001/ephys/Record Node 104/experiment1/recording2

Loading data from path: /home/runner/work/spikewrap/spikewrap/spikewrap/examples/example_tiny_data/openephys/rawdata/sub-001/ses-001/ephys/Record Node 104/experiment1/recording1
import spikewrap as sw

session = sw.Session(
    subject_path=sw.get_example_data_path("openephys") / "rawdata" / "sub-001",
    session_name="ses-001",
    file_format="openephys",
    run_names="all"
)

fig = session.plot_probe(
    figsize=(12, 10),
    aspect_ratio=0.2
)
Total running time of the script: (0 minutes 0.180 seconds)